Log Insight 2.0 Binaries Available Now!
Today, we’re proud to be releasing the binaries for VMware Log Insight 2.0. (You can download the eval from MyVMware, or grab the upgrade if you are already a customer). Bill Roth talked about the release earlier at a high level, but I’d like to discuss the details. It’s hard to compete with the excitement felt when releasing a 1.0 product, but Log Insight 2.0 comes really close for me! The Log Insight team was able to achieve so much goodness in such a short period of time. Let’s take a look at some of the big improvements in 2.0, keeping in mind that these and more were all completed in less than five months:
- Distributed architecture for scale out deployments
- Machine Learning for event-type detection, also known as Intelligent Grouping.
- Log Insight Collection Framework: RESTful ingestion API, and Windows agent for WMI and Windows Application Log Files.
- Huge improvements to charting: new kinds of charts, new controls over charts, chart legends
- Major usability additions to dashboards: ability to constrain dashboards, automatic detection of potential linkages between dashboards
- Huge improvements in query performance, focused on predictable query response times.
- New look and feel and huge usability improvements to interactive analytics including inline charts
- Improved user experience for automating configuration of ESXi logging
There’s too much material to cover in a single blog post, so I’m going to break up the topics across multiple blog posts. Today I’ll address scale-out deployments and machine learning for event-type detection.
Distributed Architecture for Scale-out Deployments. Log Insight 2.0 now supports up to six full size nodes that create a single virtual Log Insight 2.0 instance, allowing six-times the ingestion level, query level, and database size. Moving from a single node system to a distributed system was a complicated feat. Not only do you have to handle distribution of incoming data and queries, but you also have to handle lots of different failure scenarios, distributed upgrades, distributed configuration, distributed monitoring, and more. We have approached cluster management with the same ruthless attention to usability and complexity reduction that you’ve seen in past Log Insight features, so almost none of this complexity will be visible to you! Deploying a Log Insight 2.0 cluster is almost as easy as deploying a single node of Log Insight. There is one additional question in the startup wizard: are you starting a new cluster, or joining an existing one? If you are joining an existing one, you just need to provide the name or IP address of a node in the existing cluster. All in, a Log Insight 2.0 cluster should be significantly lower cost both to install and to maintain than competing solutions.
Log Insight 2.0 supports increased scale with minimal overhead by partitioning the data across all nodes in the Log Insight 2.0 cluster. Using a traditional load balancer, incoming data, either syslog or via the new RESTful collection API, is routed to any node in the cluster. We call these worker nodes. Each worker node independently indexes data arriving to its node, answers queries for the data residing on its node, and manages its own data retention. No communication is required between worker nodes, leading to an efficiently scalable architecture. One of the nodes in the cluster serves as a query coordinator. The query coordinator runs the user interface web server, breaks a user query into sub-queries to each of the worker nodes, merges the results from those sub-queries, and incrementally feeds results back to the user interface.

The end effect of these technological improvements is a Log Insight 2.0 cluster that is rated to handle 6×7500 = 45,000 events per second (eps) without message loss while concurrently enduring a reasonably heavy query load. If your query load is pretty light, you should be able to easily get more than 60,000 eps (let us know how high you get!).
Machine Learning for Event Type Detection. One of the core value propositions of Log Insight is the transformation of unstructured data into a form where it can be queried and analyzed like a SQL database. In v1 of Log Insight, structure was defined either in content packs or manually through the user interface (with one-click field extraction). With v2, Log Insight automatically discovers the structure within the unstructured data, and extends its user interface to enable powerful summarization and discovery capabilities over that structure. This schema discovery works on any text/unstructured event data – even data that has never been seen before. So Log Insight is now more effective than ever in analyzing your proprietary application log data.
To understand how the event type detection works, it helps to review how these log messages are created. In the programming code of the software being monitored, there is a line that looks like this:
printf(“API call took %d miliseconds”, ms);
The first argument is called the format string and the second argument is the variable whose value replaces the “%d”. %d also defines a data-type – in this case an integer. The goal of event type detection is to discover the format strings that were used to create each message we observe in the event stream, without access to the original source code or other prior knowledge.
Log Insight uses three steps to detect event-types. In the first step, incoming messages are clustered together using machine learning so that messages that have many similar terms in them are grouped together. Each message is assigned an event_type corresponding to the cluster in which it is placed. This clustering happens in-line with ingestion, but is so fast that it does not slow down the ingestion pipeline (compared to v1).
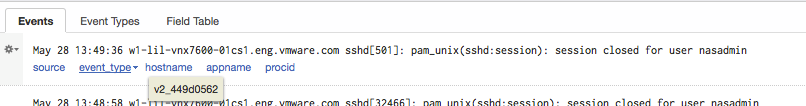
In the second step, Log Insight examines each cluster, and applies a different kind of machine learning to learn a regular expression for each distinct value of event_type. This is where Log Insight comes up with a format string – clearly identifying the parts of the message that are the same for every message of a distinct event_type and what parts are variable. The parts that vary become fields that can be queried like a database column – we call them smart fields. Finding a good regular expression is challenging – there are many regular expressions that match, but we want to select one that is as specific as possible while still matching all events in the event_type. In the Event Types view, you can see the results of this – the text in black is the same for every message of that event type, and the smart fields show up in blue. In Figure 3, we can immediately see something interesting – because the hostname and username are black, we know that every single message of this event type comes from the same source and user.

In the third step, Log Insight analyzes each smart field, and assigns a data type to that section, with possible types including timestamps, hostnames, IP addresses, integers, strings, etc. In the figure below, you can see that Log Insight has identified that the first smart field is a timestamp.

Once the structure has been detected, the formerly unstructured data can now be queried like a database where each smart field is like a column in your database table. You can aggregate across values of a smart field, group-by values of a smart field, limit your results to specific values of a smart field and more. You can also supply your own names for smart fields, so that they are easier to reference in the future. The Event Types view is, at its core, the results of your query “group by event_type”. It’s a powerful view that can summarize a massively large number of messages into a more easily processed number of distinct event types.
The machine learning event type detection capability brings the power of automated computer analytics to assist you with IT operations. Its automated schema detection will significantly accelerate time to value with new types of log data, and its summarization capabilities will significantly reduce your information overload, allowing you to quickly focus in on the novel or interesting information in your logs. In a future blog post, I’ll review how our new inline charting allows you to quickly explore different sub-dimensions of the data from the Event Types screen.
Author & Article Source: Bill Roth \ Jon Herlocker | VMware Blogs